 Source: Ballout, D. 2013. Choke Points: Our energy access points. Oil Change.
Preface. Below are several articles I’ve collected since 2005 on oil chokepoints. If oil tanker traffic were stopped on one or more, much of the world would plunge into a financial and energy crisis.
The U.S. has been far less vulnerable to shortages of Middle Eastern oil than the rest of the world by having our own oil and diversifying to Central & South American, Canadian, and other sources.
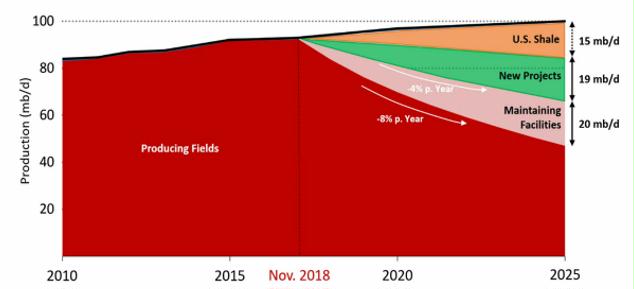
But that is changing. World oil peaked in 2018, and fracking will likely peak from 2024 to 2029. The U.S. and all other nations will become more dependent on OPEC, with 82% of remaining conventional oil reserves. Conventional is easier and cheaper than fracked, tar sands, or Venezuelan oil which cost much more to obtain plus need expensive refining (Newman 2018).
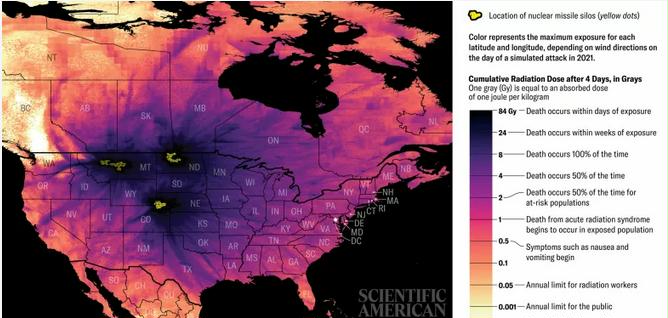
China and Southeast Asia have more glittery gadgets to sell in exchange for the remaining oil in the Middle East, and their blue navy is the strongest in the world and much closer to the Middle East. Because the U.S. restarted the Cold War arms race, China has gone from 200 nuclear missiles in 2020 to 1500 by 2030 (the U.S. has about 5,000 of the 13,000 nuclear missiles in the world). Since just 100 bombs dropped by any nation(s) would create a nuclear winter that would kill up to 5 billion people, the consequences of a chokepoint being blocked increases the chance of nuclear war.
Piracy and chokepoints in the news:
2021 Pirates Plague Mexico’s Offshore Oil Platforms: Incidents of piracy in the Mexican waters in the Gulf of Mexico have led to calls to Mexico’s Navy to increase its presence in the area where pirate attacks on vessels and oil platforms have been rising. Last month armed thieves attacked the Sandunga oil platform in the Bay of Campeche, stole equipment and belongings of rig workers, and fled with speed boats and there have been another 11 serious incidents against ships in the first half of 2020 alone.
Alice Friedemann www.energyskeptic.com Author of Life After Fossil Fuels: A Reality Check on Alternative Energy; When Trucks Stop Running: Energy and the Future of Transportation”, Barriers to Making Algal Biofuels, & “Crunch! Whole Grain Artisan Chips and Crackers”. Women in ecology Podcasts: WGBH, Financial Sense, Jore, Planet: Critical, Crazy Town, Collapse Chronicles, Derrick Jensen, Practical Prepping, Kunstler 253 &278, Peak Prosperity, Index of best energyskeptic posts
***
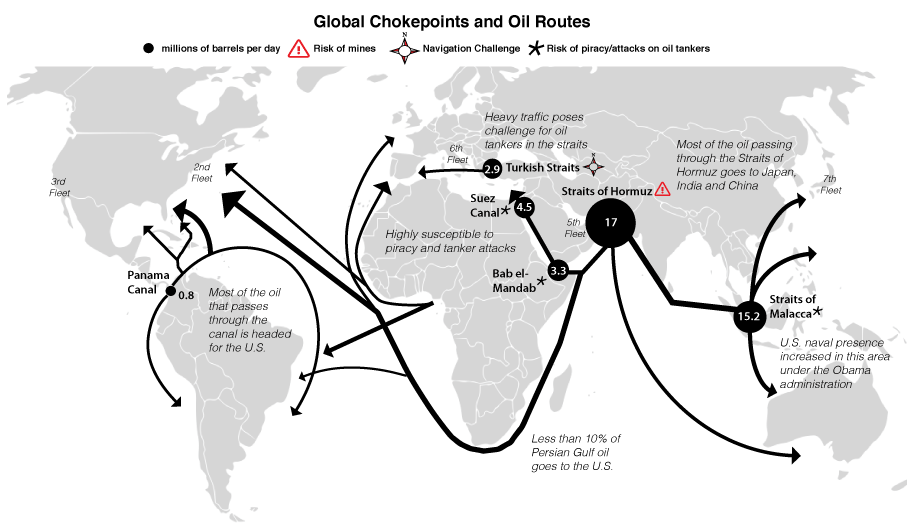
Global oil chokepoints 2018, Million barrels per day
16.8 Hormuz
15.7 Malacca
4.8 Bab-el-Mandeb
4.6 Suez canal
2.7 Bosphorus
0.8 Panama canal
7.4 Other
—-
52.9 Total seaborne oil Source: Lloyd’s list intelligence
EIA (2023) Red Sea chokepoints are critical for international oil and natural gas flows. A more detailed look at the Suez Canal, SUMED pipeline, and Bab el0Mandem Strait. (But leaves out Hormuz).
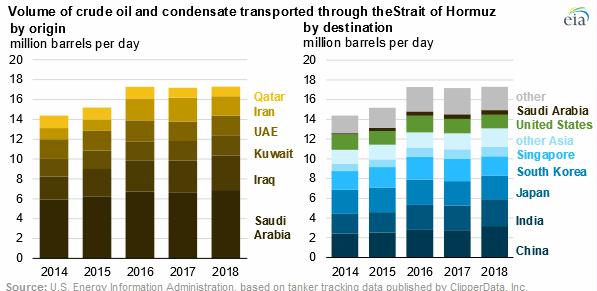
Asian nations will be most affected if war closes the straits of Hormuz
60% percent of America’s oil arrives on vessels.
Due to the narrowness of the straits all of them can be disrupted with relative ease by piracy, terrorism, wars, or shipping accidents, affecting the supply of oil and world prices.
The strong dependence of the U.S. economy on oil has made it of the utmost importance to guarantee the free flow of shipments through these straits. For this reason policing has fallen mainly on the U.S. Navy with the help of some allies. Cost estimates of maritime patrolling for the U.S. have been calculated to range between $68 and $83 billion per year, or 12 to 15 percent of conventional military spending. The rest of the world has benefited freely from this security provided by the U.S.
As long as the U.S. economy continues to depend heavily on oil it will have to incur in the high maritime patrolling costs to guarantee the free flow of oil through these critical straits.
According to John Hofmeister, former president of Shell Oil, “With respect to the choke points, the three most serious are the Suez Canal, the Hormuz Straits, which is separating Yemen from Oman and Iran, and the Straits of Malacca, which is between Malaysia and Indonesia. These choke points carry enormous amounts of crude oil. Matt Simmons used to speak of the Straits of Hormuz as, we live one day away from an oil Pearl Harbor. In other words, those Straits of Hormuz transport between 20 and 25% of daily consumption of global oil, and were they to be shut in, the world would be in a panic overnight if it were not possible to pass oil.
The Straits of Hormuz watch about 20 to 25% of the world’s daily crude oil production move through it, and if the world were to lose that amount of oil because of a shutdown in the Straits, I think that the immediate impact on crude oil prices would be to not just double but even triple the current crude oil price of the panic that would set in in terms of future contracting. There might be a slight delay to see how long it make take to clean up the mess that might be created there but it is such a critical pinch point and there is so much of that oil that goes both east and west that it is not only energy security for the United States, it is energy security for the world’s second largest economy, China. And so the consequence would be dramatic. Five dollars would look cheap in terms of a gasoline price in the event of the Straits of Hormuz being shut in.” (Serial No. 112-4).
Attack on Abqaiq
The National Commission on Energy Policy and Securing America’s Energy Future conducted a simulation called Oil Shock Wave to explore the potential security and economic consequences of an oil supply crisis. The event started by assuming that political unrest in Nigeria combined with unseasonably cold weather in North America contributed to an immediate global oil supply shortfall. The simulation then assumed that 3 terrorist attacks occur in important ports and processing plants in Saudi Arabia and Alaska which sent oil prices immediately soaring to $123 a barrel and $161 barrel 6 months later. At these prices, the country goes into a recession and millions of jobs are lost as a result of sustained oil prices. This simulation almost became reality with the failed attack on Abqaiq in Saudi Arabia in February 2006. Had the attack been successful, it would have removed 4to 6 million barrels per day from the global market sending prices soaring around the world and would likely have had a devastating impact on our economy. (Indiana Senator Evan Bayh, U.S. SENATE March 7, 2006. Energy independence S. HRG. 109-412)
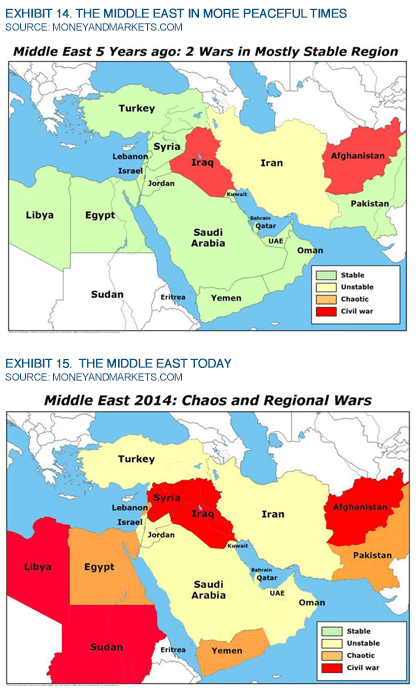
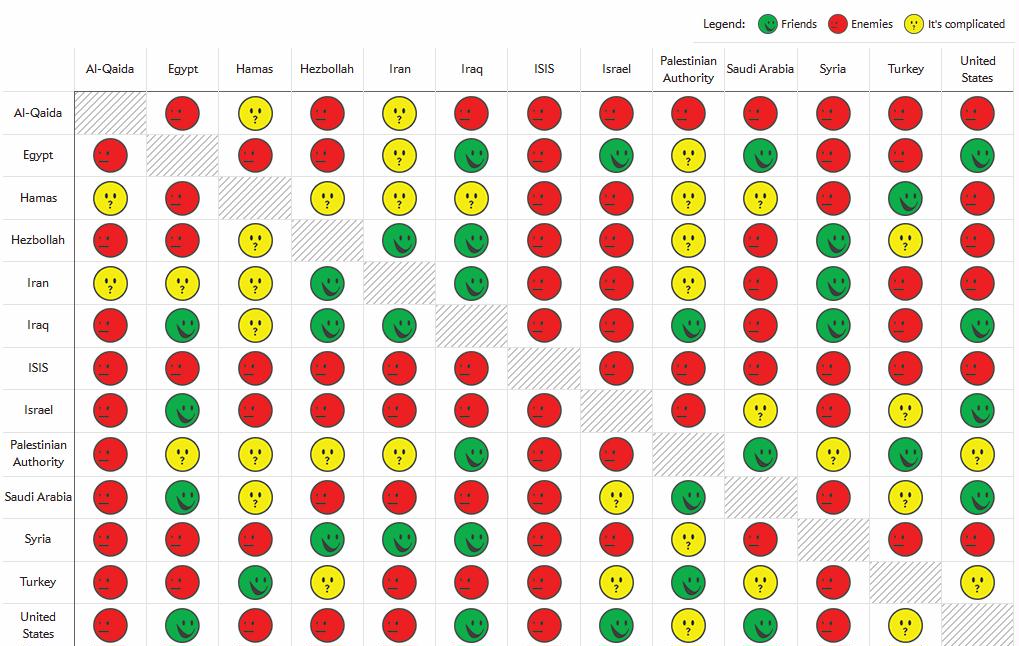
Keating, J. July 17, 2014. The Middle East Friendship Chart. slate.com
Ras Tanura port in Saudi Arabia: 10% of the world’s oil
Peter Maass. The Breaking Point. August 21, 2005 The New York Times
Saudi Arabia had 22% of the world’s oil reserves (in 2005) The largest oil terminal in the world is Ras Tanura, on the east coast of Saudi Arabia, along the Persian Gulf. Ras Tanura is the funnel through which nearly 10 percent of the world’s daily supply of petroleum flows. In the control tower, you are surrounded by more than 50 million barrels of oil, yet not a drop can be seen.
As Aref al-Ali, my escort from Saudi Aramco, the giant state-owned oil company, pointed out, ”One mistake at Ras Tanura today, and the price of oil will go up.” This has turned the port into a fortress; its entrances have an array of gates and bomb barriers to prevent terrorists from cutting off the black oxygen that the modern world depends on. Yet the problem is far greater than the brief havoc that could be wrought by a speeding zealot with 50 pounds of TNT in the trunk of his car. Concerns are being voiced by some oil experts that Saudi Arabia and other producers may, in the near future, be unable to meet rising world demand. The producers are not running out of oil, not yet, but their decades-old reservoirs are not as full and geologically spry as they used to be, and they may be incapable of producing, on a daily basis, the increasing volumes of oil that the world requires. ”One thing is clear,” warns Chevron, the second-largest American oil company, in a series of new advertisements, ”the era of easy oil is over.”
If consumption begins to exceed production by even a small amount, the price of a barrel of oil could soar to triple-digit levels. This, in turn, could bring on a global recession, a result of exorbitant prices for transport fuels and for products that rely on petrochemicals — which is to say, almost every product on the market. The impact on the American way of life would be profound: cars cannot be propelled by roof-borne windmills. The suburban and exurban lifestyles, hinged to two-car families and constant trips to work, school and Wal-Mart, might become unaffordable or, if gas rationing is imposed, impossible.
Ghawar is the treasure of the Saudi treasure chest. It is the largest oil field in the world and has produced 55 billion barrels of oil the past 50 years, more than half of Saudi production in that period. The field currently produces more than five million barrels a day, about half of the kingdom’s output. If Ghawar is facing problems, then so is Saudi Arabia and, indeed, the entire world.
Simmons found that the Saudis are using increasingly large amounts of water to force oil out of Ghawar. “Someday the remarkably high well flow rates at Ghawar’s northern end will fade, as reservoir pressures finally plummet. Then, Saudi Arabian oil output will clearly have peaked Simmons says that there are only so many rabbits technology can pull out of its petro-hat.
Strait of Hormuz
Any military action in the Strait of Hormuz in the Gulf would knock out oil exports from OPEC’s biggest producers, cut off the oil supply to Japan and South Korea and knock the booming economies of Gulf states.
Roger Stern, a professor at the University of Tulsa National Energy Policy Institute, estimates we’ve spent $8 trillion protecting oil resources in Persian Gulf since 1976, when the Navy first began increasing its military presence in the region following the first Arab oil embargo. We did this because we feared oil supplies would run out, and that the Soviets would march to the Persian gulf to get oil when they ran low themselves (Stern). We import very little of this oil, yet Japan, Europe, India, and the nations that do don’t pay us to do this. Admiral Greenert plans to shift 10% of our navy from the East Coast to the Pacific Coast to protect the South china seas (from China).
Here are some key facts on what passes through the international waterway and some of the direct economic consequences of any attack on merchant shipping.
- 20 percent of the world’s oil traded worldwide (35% of all seaborne oil), and 20% of the global liquefied natural gas (EIA).
- 2.9 billion deadweight tons passes through the strait every year.
- Crude oil exported through the Strait rose to 750 million tons in 2006.
- 27 percent of transits carry crude on oil tankers, rising to 50 percent if petroleum products, natural gas and Liquefied Petroleum Gas transits are included.
- Transits for dry commodities like grains, iron ore and cement account for 22 percent of transits.
- Container trade accounts for 20% of transits, carrying finished goods to Gulf countries.
Oil exports passing through Hormuz: (2006 figures)
- Saudi Arabia — 88 percent
- Iran — 90 percent
- Iraq — 98 percent
- UAE — 99 percent
- Kuwait — 100 percent
- Qatar — 100 percent
Top 10 importers of crude oil through Hormuz (2006 figures)
- Japan — Takes 26% of crude oil moving through the strait (shipments meet 85% of country’s oil needs)
- Republic of Korea — 14 percent (meets 72 percent of oil needs)
- United States — 14 percent (meets 18 percent of oil needs)
- India — 12 percent (meets 65 percent of oil needs)
- Egypt — 8 percent (N.B. most transhipped to other countries)
- China — 8 percent (meets 34 percent of oil needs)
- Singapore — 7 percent
- Taiwan — 5 percent Thailand — 3 percent
- Netherlands — 3 percent (Source: Lloyd’s Marine Intelligence Unit)
U.S. Energy Security Strait of Hormuz Threat – All OPEC imports from the Persian Gulf region are shipped via marine tankers through the Strait of Hormuz. Due to Iran’s developing nuclear arms program and Israel’s perception of this being a threat, which could lead to conflict if Israel makes a first strike against Iran (regardless of whether the threat is verified or not), and U.S. sanctions to possibly curtail Iran’s nuclear arms development, Iran has threatened to the shutdown of the Strait of Hormuz in retaliation. If and when Iran carries out their threat to shutdown the Strait of Hormuz the U.S. would immediately lose about 2.2 MBD of crude oil imports or almost 12% of current total petroleum oil supplied (consumed); far greater than the 4% lost during the 1973 Arab OPEC oil embargo.
Strait of Hormuz Shutdown Impacts – The impact of losing all Persian Gulf imports could be substantial. Not only would the U.S. be subjected to a very quick loss of 2.2 MBD of imports, but the impact on world markets could also be devastating (up to 20% of all world market crude oil supplies currently flow through the Strait). World oil prices could directionally double almost overnight, sending world energy markets and economies into chaos. While the U.S. and UN conventional military forces should be able to readily take-on and neutralize Iran’s conventional forces, it’s Iran’s small-independent, unconventional forces that likely pose the greatest and longer term threat to Persian Gulf shipping and regional OPEC oil infrastructures.
Other Chokepoints (EIA)
- Strait of Malacca with 17% of the world’s oil, most of it headed to China, Japan and South Korea.
- Suez Canal / SUMED pipeline with 5% of world oil, key routes for oil destined for Europe and North America. A potential threat is the growing unrest in Egypt since their revolution in 2011.
- Bab el-Mandab could keep tankers from the Persian gulf from reching the Suez canal and sumed pipeline
- Turkish Straits. Increased oil exports from the Caspian Sea region make the Turkish Straits one of the most dangerous choke points in the world supplying Western and Southern Europe.
- Danish Straits, an increasingly important route for Russian oil to Europe.
Also read:
Sullivan’s testimony in: HR 112–24. March 31, 2011. Rising oil prices and dependence on hostile regimes: the urgent case for Canadian oil. U.S. House of Representatives. 102 pages
Brooks, G. Allen. March 21, 2014.Musings: The Challenges Facing Saudi Arabia Include More Than Oil. rigzone.com
References
EIA. 2012 U.S. Energy Information Administration “World Oil Transit Chokepoints”.
EIA. 2019. How much petroleum does the United States import and export? U.S. Energy Information Administration.
FACTBOX: Strait of Hormuz: economic effects of disruption. Jan 7, 2008. Stefano Ambrogi. Reuters
Klug, F. 2019. Middle East attack jolts oil-import dependent Asia. Washington Post.
Miller, J. August 20, 2013. What are the Largest Risks to U.S. Energy Security? TheEnergyCollective.com
Newman, N. 2018. Middle East Leads Global Supply of Conventional Oil. Rigzone.
Serial No. 112-4. February 10, 2011. The effects of middle east events on U.S. Energy markets. House of Representatives, subcommittee on energy and power 112th congress. 231 pages
Semple K (2020) Piracy Surges in Gulf of Mexico, Prompting U.S. Warning. There have been scores of attacks in Mexican waters, taxing the country’s overstretched security forces. New York Times.
Stern, R. 2010. United States cost of military force projection in the Persian Gulf, 1976–2007. EnergyPolicy.

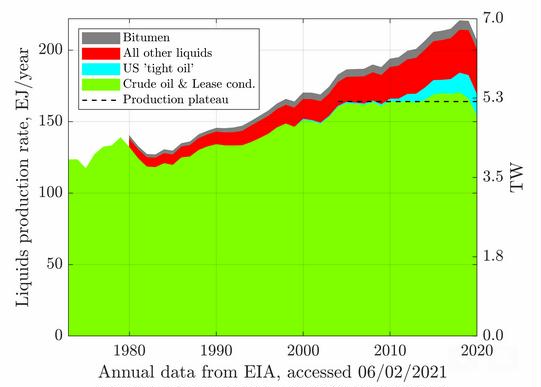 Source: Tad Patzek.
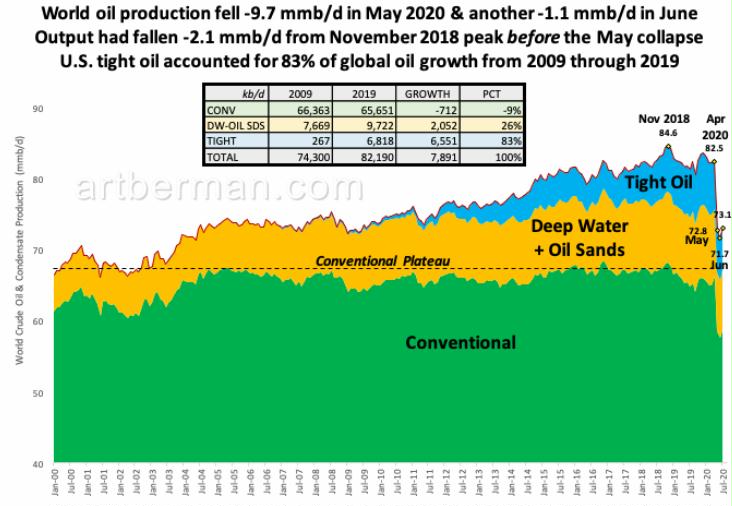

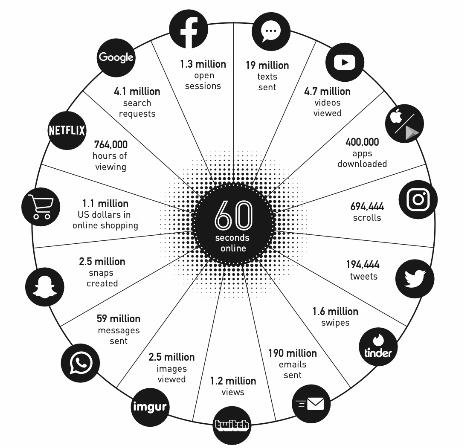 One minute on the internet around the world. Source Infographic by @LoriLewas and @officiallyChad, 2020.